Have you ever wondered if the market could suddenly drop? Stock market crashes can shake even the most experienced investor. Prices can tumble quickly, much like a stack of cards, when risky moves and too much borrowed money are involved.
Think of it like driving on icy roads; one small slip can lead to a sharp skid. In this article, we explain how factors such as margin debt and low cash reserves cause these sudden falls and share smart, clear strategies to help you navigate rough financial weather.
Stock Market Crash Fundamentals: Understanding Causes and Indicators
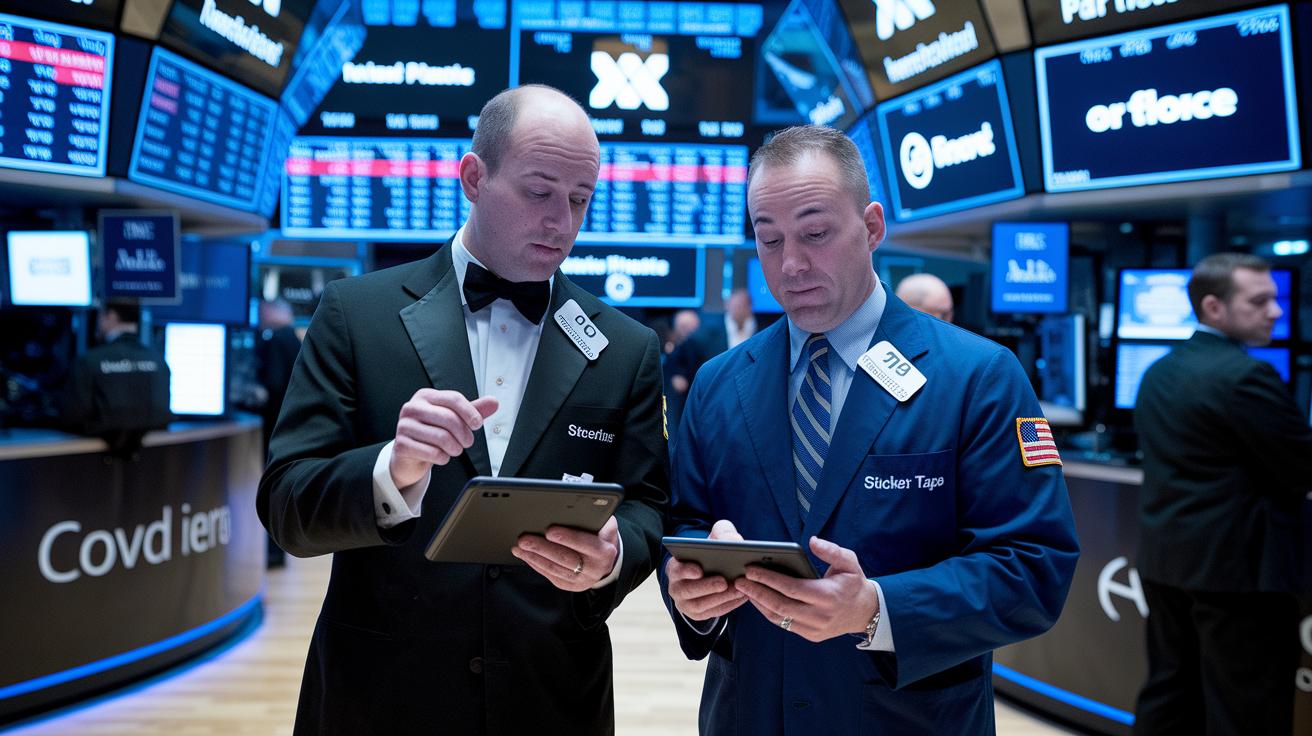
A stock market crash happens when prices drop sharply in a short span. It shakes investor confidence and is often driven by risky bets, borrowing too much money (margin debt), and not enough buyers (liquidity crunches). Speculation is when investors gamble on rising markets, while margin debt means taking on loans to buy stock, making you extra vulnerable when prices fall. And a liquidity crunch occurs when there aren’t enough buyers to pick up the stocks being sold, pushing prices down even more.
Sometimes, a big drop in a well-known stock acts as a warning sign. For example, if a popular stock suddenly loses value, it could mean panic selling is starting. Volatile price swings also hint that something isn’t right. Think of it like a roller coaster ride, if you see sudden dips, it’s a sign that the ride might be off. It’s a bit like a car skidding on ice, alerting you to an impending crash.
In today’s market, caution is key. Modern data shows that 95% of companies investing in generative AI haven’t seen any returns, even as enterprise AI spending reaches between $30 billion and $40 billion. This gap highlights how risky moves can lead to instability. Investors should also keep an eye on models that predict crashes by tracking early signs of broader economic troubles before a full market meltdown.
Monitoring these early signals can help you make smart, calculated decisions before panic takes over in a volatile trading environment.
Historic Stock Market Crash Case Study: The 1929 Market Plunge

Back in the roaring twenties, the stock market soared like a kite in a strong wind. On September 3, 1929, the market hit its highest point amid a flurry of excitement. Investors, ranging from well-off financiers to everyday workers, dove into stocks by borrowing money, a practice known as buying on margin. This method made them extra sensitive to even tiny dips, capable of wiping out years of hard-earned savings. Picture it like using a borrowed ladder to reach a high shelf; if the ladder shudders, you could fall hard.
Soon after this peak, the mood shifted almost overnight. The excitement gave way to worry when numbers started to drop. Rumors flew and investor sentiments shifted quickly, causing a rush to sell. The crash wasn’t simply bad luck; it was the result of risky bets and too much debt. As prices tumbled, margin calls forced more investors to sell, deepening the decline in a painful cycle.
This timeline is one of the most famous examples of an economic downturn. It teaches us how a market bubble can burst suddenly. When the market collapsed, many investors saw their life savings vanish in a blink. Charts showing the Dow Jones Industrial Average from October 1929 to October 1930 highlight the rapid fall and wild swings of that time. The whole episode is a clear reminder that a market can change from prosperity to deep trouble in a short span.
The 1929 crash stands as a powerful lesson in the risks of borrowing too much and riding high on unchecked speculation. By looking back at the timeline, we see how dangerous it can be to take on too much risk. Even today, these historical records help us understand the deep impact of a market collapse and remind us to be cautious during times of high market energy.
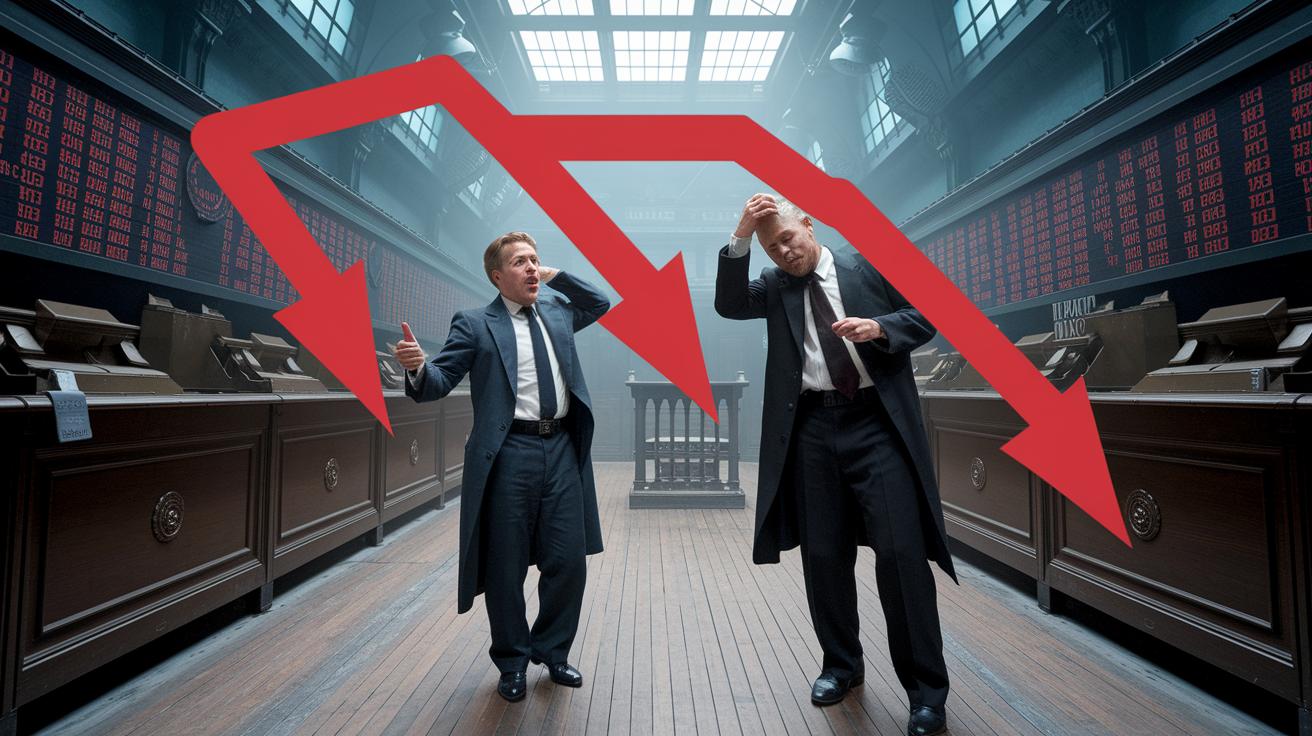
Modern Market Meltdowns: AI Bubble as a Potential Stock Market Crash Trigger
Lately, we've seen some striking drops in the stock market. Big promises around AI have left many investors disappointed. For instance, Palantir lost 10% in just one week, sparking worries that high hopes might have created a bubble. Even well-known companies like Nvidia, Arm, Oracle, and AMD are feeling the pressure when the mood shifts.
These sudden falls hint that people might be reacting more to short-term news than to solid, long-term plans. When a stock like Palantir slips, it can lead investors to rethink their positions, which may start a chain reaction of quick selloffs.
- Palantir’s 10% fall in one week shows just how quickly market feelings can change.
- Drops at Nvidia, Arm, Oracle, and AMD prove that even top companies aren’t safe.
- This trend feeds a cycle where sudden price swings boost doubts and prompt more selling.
Consider this: Palantir’s sharp 10% drop in one week perfectly illustrates how far market expectations can stray from what is really happening.
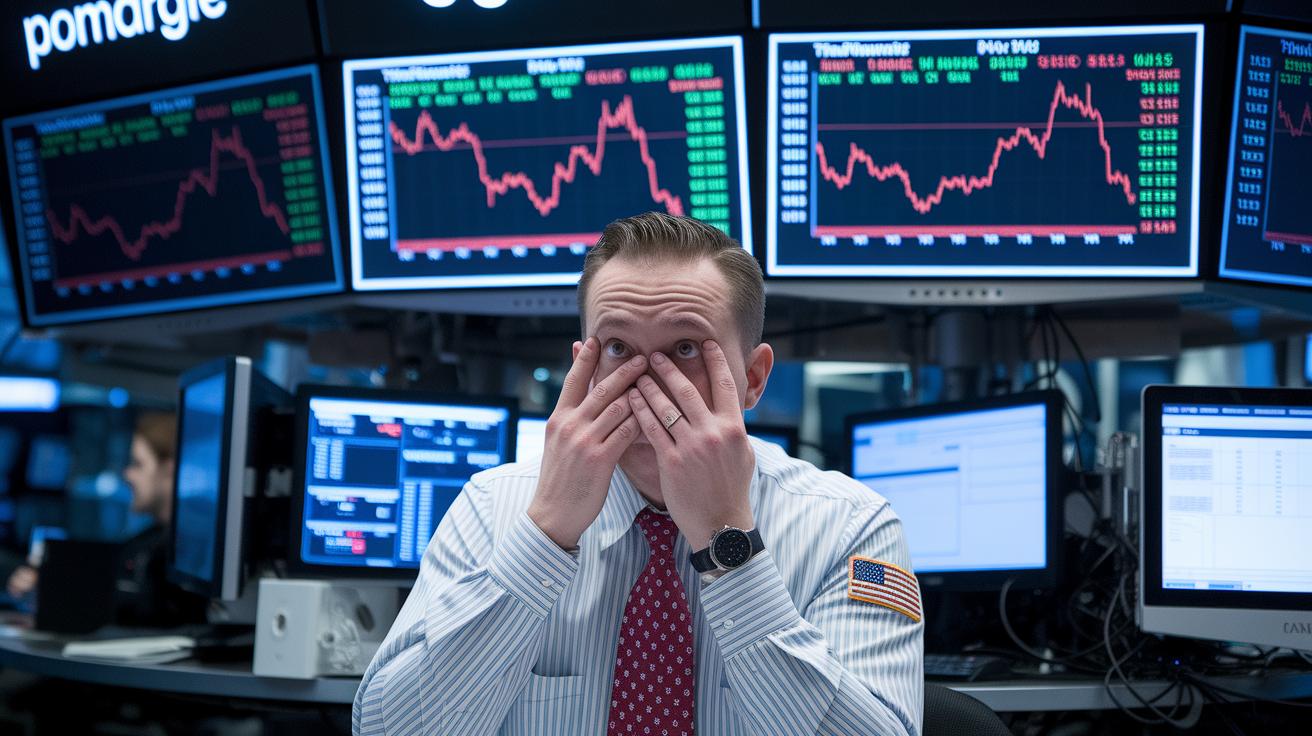
Investor Behavior During Stock Market Crashes: Panic, Volume, and Sentiment Shifts
When the stock market takes a sharp dive, many investors quickly feel overwhelmed. It’s like being in a busy room where one person starts to panic, and soon everyone is rushing to get out. Sudden spikes in trading volume and margin calls can send shockwaves that trigger quick selloffs.
Looking back at the period from October 1929 to October 1930 using Dow Jones graphs, we see how dramatic price swings came with intense trading activity. Back then, widespread use of margin led to forced selling, and that selling frenzy only fueled more drops in prices.
Investor feelings become a major player in these moments. When charts show deep valleys, many traders fear even bigger losses, which can lead to more panicked selling. On a positive note, circuit breakers step in during these times by pausing trading briefly, giving everyone a chance to catch their breath and rethink their decisions.
- Forced margin calls added extra selling pressure.
- Surges in trading volume amplified the panic.
- Circuit breakers aimed to slow the downward slide.
Post-Crash Recovery and Risk Management Strategies for Future Crises
When the economy takes a hard fall, history shows that a mix of smart government moves and spreading out investments can help steady the ship. Back during the Great Depression, firsthand accounts and books like Down and Out in the Great Depression (2008) and Freedom from Fear (1999) show how new policies and fresh strategies helped turn things around. Programs like the New Deal and actions by the Federal Reserve acted like a jump-start for a struggling engine, using the right type of fuel to get things rolling again.
Today, the idea of managing risk is built on those same lessons. It means not putting every dollar in one pile but spreading it across different types of investments. Think of it as having a balanced meal, if one dish doesn’t satisfy you, other flavors step in to keep you energized. By holding a mix of safe assets, bonds, and cash, you create a cushion for when markets get rough.
It also helps to keep an eye on how the economy bounces back and watch how bonds react during uncertain times. For instance, sticking with more stable investments instead of chasing risky, high-return bets can protect your money. Comparing government rescue plans to what's actually happening in the market might also give you clues about how best to protect your savings.
Here are a few simple tips:
- Look at past recoveries and learn which government actions made a difference.
- Spread your investments around to lower your risk.
- Keep a good mix of stocks, bonds, and cash handy.
These steps are like a roadmap for staying strong financially, even if another downturn comes along.
Final Words
In the action, we broke down the forces that spark a stock market crash, from margin buying and sharp declines to the modern pressures of an AI bubble. We examined historical examples like the 1929 plunge and the panic that can grip investors, then offered clear ways to build a stronger, smarter plan for recovery. Knowing how each element plays its part helps us feel steadier as we face market drops. Stay alert and focus on steady, informed decisions for a brighter financial future.
FAQ
Stock market crash today
The term “stock market crash today” signifies a sudden, steep drop in stock prices often caused by high investor anxiety, overvalued assets, and reduced market liquidity.
Why did the stock market crash in 1929 and what happened in 1929?
The 1929 crash occurred because rampant speculation and heavy margin buying led to overextended investments, triggering panic selling and steep price declines that wiped out many investors’ savings.
What are stock market crash prediction and the potential for a crash in 2025?
The idea behind stock market crash predictions, including a possible 2025 event, is based on concerns over economic bubbles and investor behavior, though such forecasts remain uncertain and cautionary.
What does a stock market crash graph illustrate?
A stock market crash graph illustrates the sudden, sharp declines in market indices and trading volumes, visually capturing how investor sentiment and market conditions deteriorate during a crash.
What is the meaning and history of a stock market crash?
The phrase “stock market crash” means a rapid, dramatic decline in prices. History shows these events follow periods of high optimism and end with panic selling, as seen in 1929 and other downturns.
Why are stock markets crashing?
The phrase “stock markets crashing” describes a situation where underlying issues—such as speculative excess, liquidity shortages, or shifts in investor mood—trigger widespread selling and significant price drops.
Who got rich from the 1929 stock market crash?
The story of the 1929 crash includes a few savvy investors and short-sellers who profited by betting against the market, even though most suffered major financial losses during the downturn.
Should I take my money out of the stock market now?
The idea of taking money out now depends on your financial goals and risk tolerance. It’s wise to review your strategy and possibly talk to a financial advisor for personalized advice.
What is the 7% rule in stocks?
The 7% rule in stocks refers to an expected average annual return of around 7%, serving as a benchmark to help investors plan and assess long-term growth despite short-term market swings.